Technographic Targeting for B2B Marketing: a GTM Guide
Unlock B2B success with technographic targeting. Use technology stacks for personalized outreach, short sales cycles, and faster results.

Technographic Targeting for B2B Marketing: a GTM Guide
Technographic targeting means using a company’s installed technology stack as the primary signal to prioritize and personalize B2B outreach. Instead of guessing fit from industry codes and headcount, you look at what a prospect actually runs — their CRM, analytics layer, cloud infrastructure, payment processor — and use that to decide whether they belong on your list and what to say when you reach them. The three plays that benefit most are gap-fill (they lack a tool your product completes), compatibility (your product integrates with what they already run), and displacement (they use a competitor you can replace). Short sales cycles with a clear integration story get the fastest lift. The immediate next step: pick two or three stack signals tied to your ICP, build a small account list, and run a four-week pilot before scaling. Runleadpilot automates that entire workflow from signal detection through warm-reply handoff.
Table of Contents
- What technographic data actually includes — and which categories matter
- How technographics differ from firmographics and intent data
- Top B2B use cases for technographic targeting and the KPIs to expect
- How to collect technographic data: sources, providers, and trade-offs
- How to activate technographic data in your GTM: enrich, segment, orchestrate
- Data quality, freshness, and privacy: what to expect and how to govern it
- How to measure success: KPIs, experiments, and attribution
- Common pitfalls and how to avoid them when launching
- Applied example: a LeadPilot walkthrough for a technographic-powered outbound campaign
- Key Takeaways
- Why most teams get technographic targeting wrong
- Runleadpilot turns technographic signals into pipeline without the manual work
- Further reading and sources
What technographic data actually includes — and which categories matter
Technographic data describes the technologies a company has installed, announced, or integrated — everything from front-end scripts a website scanner can read to infrastructure choices inferred from job postings and vendor press releases. It covers both what a company runs today and what it recently added or dropped.
The categories B2B teams track most often:
- CRM (Salesforce, HubSpot, Pipedrive): signals sales maturity, deal volume, and integration requirements
- Marketing automation (Marketo, Pardot, ActiveCampaign): indicates budget tier and campaign sophistication
- Analytics and BI (Google Analytics 4, Mixpanel, Looker, Snowflake): reveals data maturity and appetite for data-integration plays
- CDP and data warehouse (Segment, Databricks, BigQuery): flags companies investing in first-party data infrastructure
- E-commerce platform (Shopify, Shopify Plus, Magento, WooCommerce): determines which integrations are relevant and which payment flows apply
- Payment processors (Stripe, Braintree, Adyen): useful for fintech and payments-adjacent products
- Security and endpoint (CrowdStrike, Okta, Duo): signals compliance posture and IT-led buying
- Cloud and IaaS/PaaS (AWS, Azure, GCP): indicates infrastructure scale and DevOps maturity
- Collaboration and sales tools (Slack, Zoom, Outreach, Salesloft): reveals team structure and communication preferences
Category-level detection is often enough to qualify an account. If you sell a Salesforce-native product, knowing a prospect runs any CRM in the Salesforce ecosystem is the qualifying signal — you do not need to confirm the exact edition. Vendor-level precision matters when your pitch depends on a specific competitor weakness or a named integration.
A few concrete examples of how a single detected tool maps to an outreach angle:
- Detects Shopify Plus → lead with your e-commerce integration and reference their likely checkout volume
- Detects Snowflake → open with a data-pipeline or reverse-ETL angle, not a generic analytics pitch
- Detects Marketo but no CRM → gap-fill play; they have automation but no unified contact record
- Detects HubSpot CRM but no marketing automation → upsell or expansion angle if you sit above HubSpot in the stack
Pro Tip: When you detect a tool removal — a company that recently dropped its CRM or analytics platform — that is often a stronger signal than a static install. Budget just freed up, and the team is actively evaluating replacements.
How technographics differ from firmographics and intent data
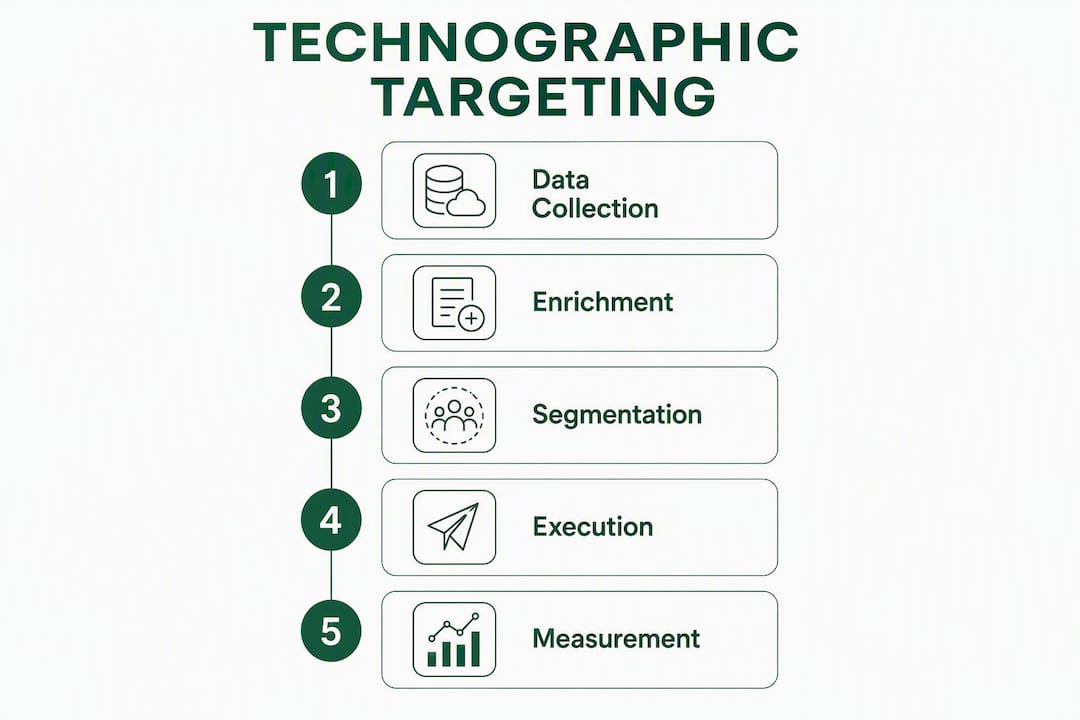
These three data types answer three different questions, and confusing them is one of the fastest ways to build a list that looks good on paper but converts poorly.
Firmographics answer who they are: industry vertical, employee count, revenue band, geography, and legal structure. They set the eligible pool — the universe of companies that could theoretically buy from you. They say nothing about whether a company has the infrastructure to use your product or the urgency to buy it now.
Intent data answers what they are researching right now: which topics, vendors, or categories a buying team is actively consuming content about. It is a timing signal, not a fit signal. A company can show strong intent for your category and still be a terrible fit because their stack is incompatible.
Technographics answer what they run operationally: the tools, platforms, and integrations already in place. This is primarily a fit and qualification signal. It tells you whether your product has a natural home in their environment — not whether they are ready to buy today.

The practical rule of thumb: use firmographics to define the eligible pool, technographics to rank that pool by operational fit, and intent data to time your outreach to the accounts already showing buying behavior. For a short-cycle SaaS product with a clear integration story, technographics alone can drive a strong pilot. For large-enterprise procurement with a six-month sales cycle, you need all three layers plus stakeholder mapping.
One warning worth repeating: do not treat technographic signals as timing signals on their own. Knowing a company runs Salesforce does not tell you they are evaluating your product this quarter. Pair technographics with intent data when timing matters, and use technographics as the filter that keeps you from wasting intent-data budget on accounts that will never fit.
Top B2B use cases for technographic targeting and the KPIs to expect
High-performing demand-gen teams use technographic segmentation to tighten targeting to accounts that have a concrete reason to buy — not just accounts that look like buyers on paper. Here are the five plays that deliver the most consistent results.
ABM and audience segmentation. Build account lists filtered by specific stack combinations (e.g., runs Marketo AND Salesforce AND lacks a CDP). This is the foundation of most ABM programs. KPIs: match rate against your ICP universe, account engagement rate, and pipeline sourced from the segment.
Targeted outbound prospecting. Replace broad industry lists with technographic-filtered lists where every account has a documented reason to care about your pitch. KPIs: open-to-reply rate versus firmographic-only baseline, lead-to-opportunity conversion, and average time to first meeting.

Competitive displacement campaigns. Identify accounts running a specific competitor and build a sequence that addresses known weaknesses in that product. This is the highest-precision play and typically the highest-converting when the messaging is sharp. KPIs: win rate against named competitor, average deal size, and sales cycle length versus historical baseline.
Compatibility and co-sell lists. Find accounts that already run a technology your product integrates with natively — your integration partner’s customer base is a pre-qualified list. KPIs: integration activation rate post-close, time-to-value, and net revenue retention.
Upsell, expansion, and retention monitoring. Track existing customers for stack changes that signal expansion opportunity (they added a new tool your product connects to) or churn risk (they dropped a tool your product depends on). KPIs: expansion revenue attributed to technographic triggers, churn rate in monitored segments.
Choosing the right play: map your average deal size and sales cycle to the signal. Short cycle, clear integration story → gap-fill or compatibility. Longer cycle, known competitor in the account → displacement. Existing customer base → expansion and retention monitoring.
For non-enterprise verticals, local-business technographic signals (site presence, HTTPS, online booking tools, payment integrations) are under-indexed by most enterprise providers but deliver high leverage when paired with domain-verified sources. A local outbound team targeting restaurants or clinics can build a highly qualified list from three or four simple signals.
How to collect technographic data: sources, providers, and trade-offs
No single source covers a company’s full stack. Website scanners detect front-end technologies reliably but miss internal tools; job postings are lagging indicators; vendor-reported data is accurate but narrow. The practical answer is to blend two or three complementary sources.
| Collection method | What it detects reliably | Typical accuracy | Best use case |
|---|---|---|---|
| Website scanner (e.g., BuiltWith, Wappalyzer) | Analytics pixels, CDNs, CMS, front-end frameworks, chat widgets | High for front-end | Quick qualification; e-commerce and martech stack detection |
| Vendor-reported / customer lists | Named integrations, certified partners, marketplace listings | High but narrow | Compatibility plays; co-sell list building |
| Job postings and hiring signals | Internal tools (CRM, HRIS, BI), infrastructure preferences | Moderate; 30–90 day lag | Inferring back-end stack; budget and priority signals |
| DNS, SSL, MX records | Email provider, hosting, CDN, security certificates | High for infrastructure | IT-led buying; security and compliance plays |
| Panel telemetry / browser panels | Broad stack coverage including SaaS apps | Moderate; panel bias possible | Enterprise stack profiling; category-level detection |
| Press releases and case studies | Named vendor relationships, recent implementations | High when present | Displacement plays; named-account research |
Accuracy by category. Front-end tools — analytics pixels, CDNs, CMS platforms, chat widgets — are reliably detected by scanners. Internal tools like CRM, HRIS, and BI platforms are often inferred from job postings or vendor case studies, which means lower confidence and a time lag. Treat inferred signals as hypotheses, not facts.
Data hygiene before you do anything else. Raw technographic exports contain inconsistent naming conventions that break segmentation. “Salesforce,” “Salesforce.com,” and “SFDC” are the same tool — but a raw export will treat them as three separate entries and miss matches. Normalize vendor names to a canonical form, tag each record with its source and detection date, and deduplicate before loading into your CRM or ABM platform.
Two complementary providers beat one broad one. A website scanner gives you fast, cheap front-end coverage. A second source — vendor-reported data or a panel-based provider — fills in the back-end gaps. Supplement both with targeted job-posting checks for high-value accounts where you need higher confidence before a rep invests time.
How to activate technographic data in your GTM: enrich, segment, orchestrate
Raw detections sitting in a spreadsheet do nothing. Here is the operational sequence that turns them into pipeline.
-
Enrich. Match each domain to your firmographic profile (industry, size, geography). Append contact records for the relevant decision-makers. Normalize all vendor names to canonical form. Tag each detection with its source (scanner, vendor-reported, job posting) and the detection date. This provenance tagging is what lets you weight signals later.
-
Segment by play type. Classify each account into gap-fill (they lack a tool your product completes), compatibility (they run a tool you integrate with), or displacement (they run a competitor). Within each segment, sort by recency: a technology added in the last 90 days is a stronger signal than one detected 18 months ago.
-
Score accounts. A practical scoring model: +30 points for a direct integration match, +20 for confirmed competitor usage with known weaknesses, +15 for a category gap your product fills, +10 for a recent adoption or a relevant job posting. Accounts above a threshold go to sales; mid-range accounts enter a nurture sequence; low-score accounts go on a monitoring list.
-
Build boolean targeting queries. Example logic for an ABM audience:
has=Salesforce AND has=Marketo AND NOT has=CDP_tool. This surfaces accounts with a clear data-integration gap. For a displacement play:has=Competitor_CRM AND employee_count>50 AND industry=SaaS. Keep queries tight — three to five conditions is usually enough. -
Route accounts. High-score accounts (direct integration match + recent signal) go straight to a sales rep with a pre-written opening line. Mid-score accounts enter a multi-touch sequence. Low-score accounts get a quarterly check for stack changes.
-
Write play-specific sequences. Gap-fill and displacement sequences need different opening lines and proof points.
- Gap-fill opener: “You’re running Marketo and Salesforce — most teams at your stage hit a wall when contact data between the two starts drifting. We fix that in one integration.”
- Displacement opener: “A few [Competitor] customers we’ve spoken with recently flagged [specific known weakness]. Happy to show you how we handle that differently in 20 minutes.”
-
Activate in ad platforms. Upload your technographic-filtered account list to LinkedIn Campaign Manager or a demand-side platform for account-targeted display. Boolean-filtered lists dramatically improve match rates compared to broad industry targeting.
Pro Tip: Set up change alerts for new tool adoptions and removals in your highest-priority accounts. A company that just added a new CRM is in active evaluation mode — that is the window to reach them, not six months later when the implementation is locked in.
Data quality, freshness, and privacy: what to expect and how to govern it
Technographic data in 2026 is denser, cheaper, and noisier than it was three years ago. More coverage means more false positives — legacy installs that a company stopped using, tools detected from a single page visit, or vendor names that got normalized incorrectly. Treat every detection as a hypothesis until you have corroborating evidence.
Common quality problems:
- Stale detections: a tool detected 12 months ago may have been replaced. Front-end tools refresh faster; back-end inferences can sit stale for a year or more.
- False positives from legacy installs: a company may have a tracking pixel from a tool they stopped paying for. The pixel stays; the subscription does not.
- Coverage gaps in long-tail categories: enterprise providers index Fortune 5000 companies well. SMBs, local businesses, and niche verticals are often under-covered.
- Inconsistent vendor naming: covered above, but worth repeating — normalization is not optional.
Governance recommendations:
- Tag every record with source and detection date at ingest.
- For change-sensitive categories (CRM, marketing automation, primary analytics), run weekly change alerts.
- For the full account list, do a quarterly refresh — pull new detections, retire stale ones, and re-score.
- For high-value accounts before a rep invests significant time, do a spot check: look at the company’s job postings, recent press releases, and LinkedIn profiles to corroborate the detection.
Privacy and compliance (U.S. context). Technographic signals are B2B business data — they describe a company’s operational choices, not personal behavior. That said, when you enrich technographic records with individual contact data, you are handling personal information. Follow CAN-SPAM requirements for commercial email: include a physical address, honor opt-outs promptly, and never use deceptive subject lines. If you are running contact-level enrichment that pulls personal data, apply appropriate internal security controls and document your data sources. For teams selling into regulated industries (healthcare, finance), confirm that your data providers’ collection methods align with your customers’ compliance expectations.
Spot-checking workflow for high-value accounts: before a senior rep spends time on an account, verify the top two or three detected tools against at least one corroborating source (job posting, case study, or LinkedIn skill endorsements). It takes five minutes and prevents the embarrassing opening line that references a tool the prospect replaced two years ago.
How to measure success: KPIs, experiments, and attribution
The right measurement framework depends on which play you are running, but a few KPIs apply across all of them.
Primary KPIs to track:
- Match rate: the percentage of your ICP accounts that have usable technographic signals. Low match rate means your data provider does not cover your segment well — fix the data before scaling the campaign.
- Open-to-reply rate vs. baseline: compare technographic-targeted sequences against your firmographic-only control. This is the clearest early signal of whether the targeting is working.
- Lead-to-opportunity conversion: the rate at which technographic-sourced leads convert to qualified pipeline. Track this separately from your overall conversion rate.
- Average deal size by segment: displacement plays often close at higher ACV than gap-fill plays. Knowing this helps you prioritize which play to scale.
- Sales cycle length: technographic targeting should shorten cycles by improving qualification upfront. If it is not, the signal-to-motion alignment is off.
- Pipeline attributed to technographic segments: use account-level attribution in your CRM, tag contacts with signal provenance at enrichment, and track assisted conversions from ad platforms.
Suggested experiments. Run an A/B test: technographic-targeted sequences in the treatment arm, firmographic-only targeting in the control. Keep everything else constant — same rep, same sequence length, same send cadence. Run it for four to six weeks and measure open-to-reply and lead-to-opportunity. For displacement plays specifically, run a small vertical pilot (one competitor, one industry) and compare win rate against your historical baseline for that vertical.
Measurement cadence. Check sequence engagement weekly — open rates and reply rates tell you fast whether the messaging is landing. Review conversion rates monthly. Assess pipeline impact quarterly, when you have enough data to see whether technographic-sourced accounts are converting to closed-won at a different rate than the rest of your pipeline.
Common pitfalls and how to avoid them when launching
Most technographic campaigns underperform not because the data is bad but because the setup is wrong. These are the mistakes that show up most often.
Top pitfalls:
- Treating single-source detections as facts. One scanner saying a company runs a specific tool is a hypothesis. Corroborate before building a sequence around it.
- Over-indexing on a single technology. A company running Salesforce is not automatically a good fit for every Salesforce-adjacent product. Layer in firmographics and deal-size filters.
- Not aligning signals to a sales motion. Knowing a prospect uses a tool is useless without a clear “why” tied to the sales motion — gap-fill, compatibility, or displacement. Data without a selling question is just a list.
- Ignoring refresh cadence. Static snapshots go stale fast. A company that ran HubSpot 18 months ago may be on Salesforce today.
- Skipping vendor name normalization. Covered in the methodology section, but it breaks segmentation in production more often than any other single issue.
Best practices for launch:
- Start with two or three signals, not twenty. Complexity kills pilots.
- Normalize vendor names before any segmentation step.
- Weight signals by recency and source confidence — a job posting from last week outweighs a scanner detection from eight months ago.
- Write separate sequences for gap-fill and displacement plays. The opening line, proof point, and offer are different for each.
- Build a measurement plan before you send the first email. Know what you are trying to prove and how you will read the results.
Launch-readiness checklist:
- ICP definition confirmed and mapped to specific stack signals
- Detection and normalization rules documented
- Routing rules set (high score → rep, mid → nurture, low → monitor)
- Sample outreach scripts written for each play type
- Measurement plan in place (baseline metrics captured, experiment design agreed)
- Data refresh cadence scheduled
Pro Tip: Configure change alerts for tool adoptions and removals in your top-tier accounts. A new adoption signals active budget and evaluation; a removal signals a gap just opened. Both are better outreach triggers than a static detection from a quarterly data pull.
Applied example: a LeadPilot walkthrough for a technographic-powered outbound campaign
Here is how a lean B2B sales team operationalizes technographic targeting end-to-end using Runleadpilot, from signal detection through warm-reply handoff.
Step 1: ICP detection from your website. Runleadpilot reads your website and infers your ideal customer profile — the industry verticals, company sizes, and buying triggers that match what you sell. No manual ICP brief required, though you can refine it.
Step 2: Technographic enrichment. The platform identifies accounts that match your ICP and enriches them with technographic signals — installed tools, detected stack categories, and recent changes. Accounts are scored by integration fit and signal recency.
Step 3: Segment and prioritize. Accounts are tiered automatically: high-fit accounts (direct integration match or confirmed competitor usage) go to the active outreach queue. Mid-fit accounts enter a nurture track. Low-fit accounts are monitored for stack changes.
Step 4: Personalized sequence drafting. Runleadpilot drafts cold email sequences from real business signals — not templates. A gap-fill account gets an opening line referencing the specific tool gap. A displacement account gets a line that addresses the known weakness of the competitor they run. The outbound sales automation layer handles follow-up timing and sequence logic.
Step 5: Deliverability management. Dedicated sending domains and inboxes are configured and warmed before the first send. This is the piece most lean teams skip and then wonder why their open rates are low.
Step 6: Follow-up and reply routing. Automated follow-ups run on schedule. When a prospect replies, the conversation is flagged and routed to the human team for handling. No reply falls through the cracks.
Validation checklist before launching paid managed outreach:
- Review the sample account list from the free campaign preview — confirm the technographic signals match your ICP
- Check two or three accounts manually against a corroborating source (job posting, LinkedIn, press release)
- Review the drafted sequences for each play type — confirm the opening lines reference the right signals
- Confirm routing rules: which replies go to which rep, and what the handoff SLA is
Sample campaign timeline:
- Week 1: ICP detection, technographic enrichment, account scoring, sequence drafting, domain warm-up
- Week 2: First sends to high-score accounts; monitor open and reply rates daily
- Week 3: Mid-score accounts enter nurture; first replies routed to sales
- Week 4: Review open-to-reply rate vs. baseline; adjust messaging for underperforming segments; decide whether to scale
Early metrics to watch during the pilot: open rate (benchmark against your firmographic-only baseline), reply rate, and the ratio of positive replies to total replies. A high open rate with low positive replies usually means the targeting is right but the messaging is off. Low open rates usually mean deliverability or subject line issues.
Key Takeaways
Technographic targeting works when signals are tied to a specific sales motion — gap-fill, compatibility, or displacement — and treated as hypotheses to validate, not facts to act on blindly.
| Point | Details |
|---|---|
| Lead with the right play | Map each technographic signal to a gap-fill, compatibility, or displacement motion before writing a single email. |
| Normalize data first | Standardize vendor names (Salesforce, Salesforce.com, SFDC → one canonical name) before any segmentation step. |
| Blend collection sources | Combine website scanners with job postings and vendor-reported data; no single source covers a company’s full stack. |
| Measure against a baseline | Run a four-week A/B test comparing technographic-targeted sequences against firmographic-only control to prove lift. |
| Runleadpilot handles the full workflow | Runleadpilot automates ICP detection, technographic enrichment, personalized sequence drafting, deliverability, and reply routing for lean teams. |
This article covers general B2B marketing and sales practices. Confirm current data privacy and email compliance requirements with a qualified professional or the relevant regulatory authority for your specific situation.
Why most teams get technographic targeting wrong
The conventional wisdom says technographic targeting is a data problem: get better data, get better results. That framing is wrong, and it leads teams to spend money on data subscriptions before they have figured out what question they are trying to answer.
The real problem is almost always alignment. A team will pull a list of 500 companies running Salesforce, write a generic “we integrate with Salesforce” email, and wonder why the reply rate is flat. The data was fine. The selling question was missing. Knowing a company runs Salesforce tells you nothing about whether they have a contact-data problem, a reporting problem, or a pipeline-visibility problem. The technographic signal is the door; the selling question is what you say when it opens.
The teams that get the most out of technographic data are the ones that start with a hypothesis about why a specific stack combination predicts a buying need — and then use the data to find accounts that match that hypothesis. That is a different mental model than “find everyone who uses X tool.” It requires knowing your product’s integration story well enough to articulate a specific problem it solves for a specific stack configuration.
The other thing most guides understate: change signals beat static detections by a wide margin. A company that has run HubSpot for three years is not in evaluation mode. A company that just added HubSpot last month is still figuring out what it needs. That is the window. Static snapshots miss it entirely.
Runleadpilot turns technographic signals into pipeline without the manual work
Most teams that understand technographic targeting well still struggle to operationalize it. Enriching accounts, normalizing vendor names, writing play-specific sequences, managing deliverability, and routing replies — that is a full SDR workflow, and lean teams do not have the bandwidth to run it manually at scale.
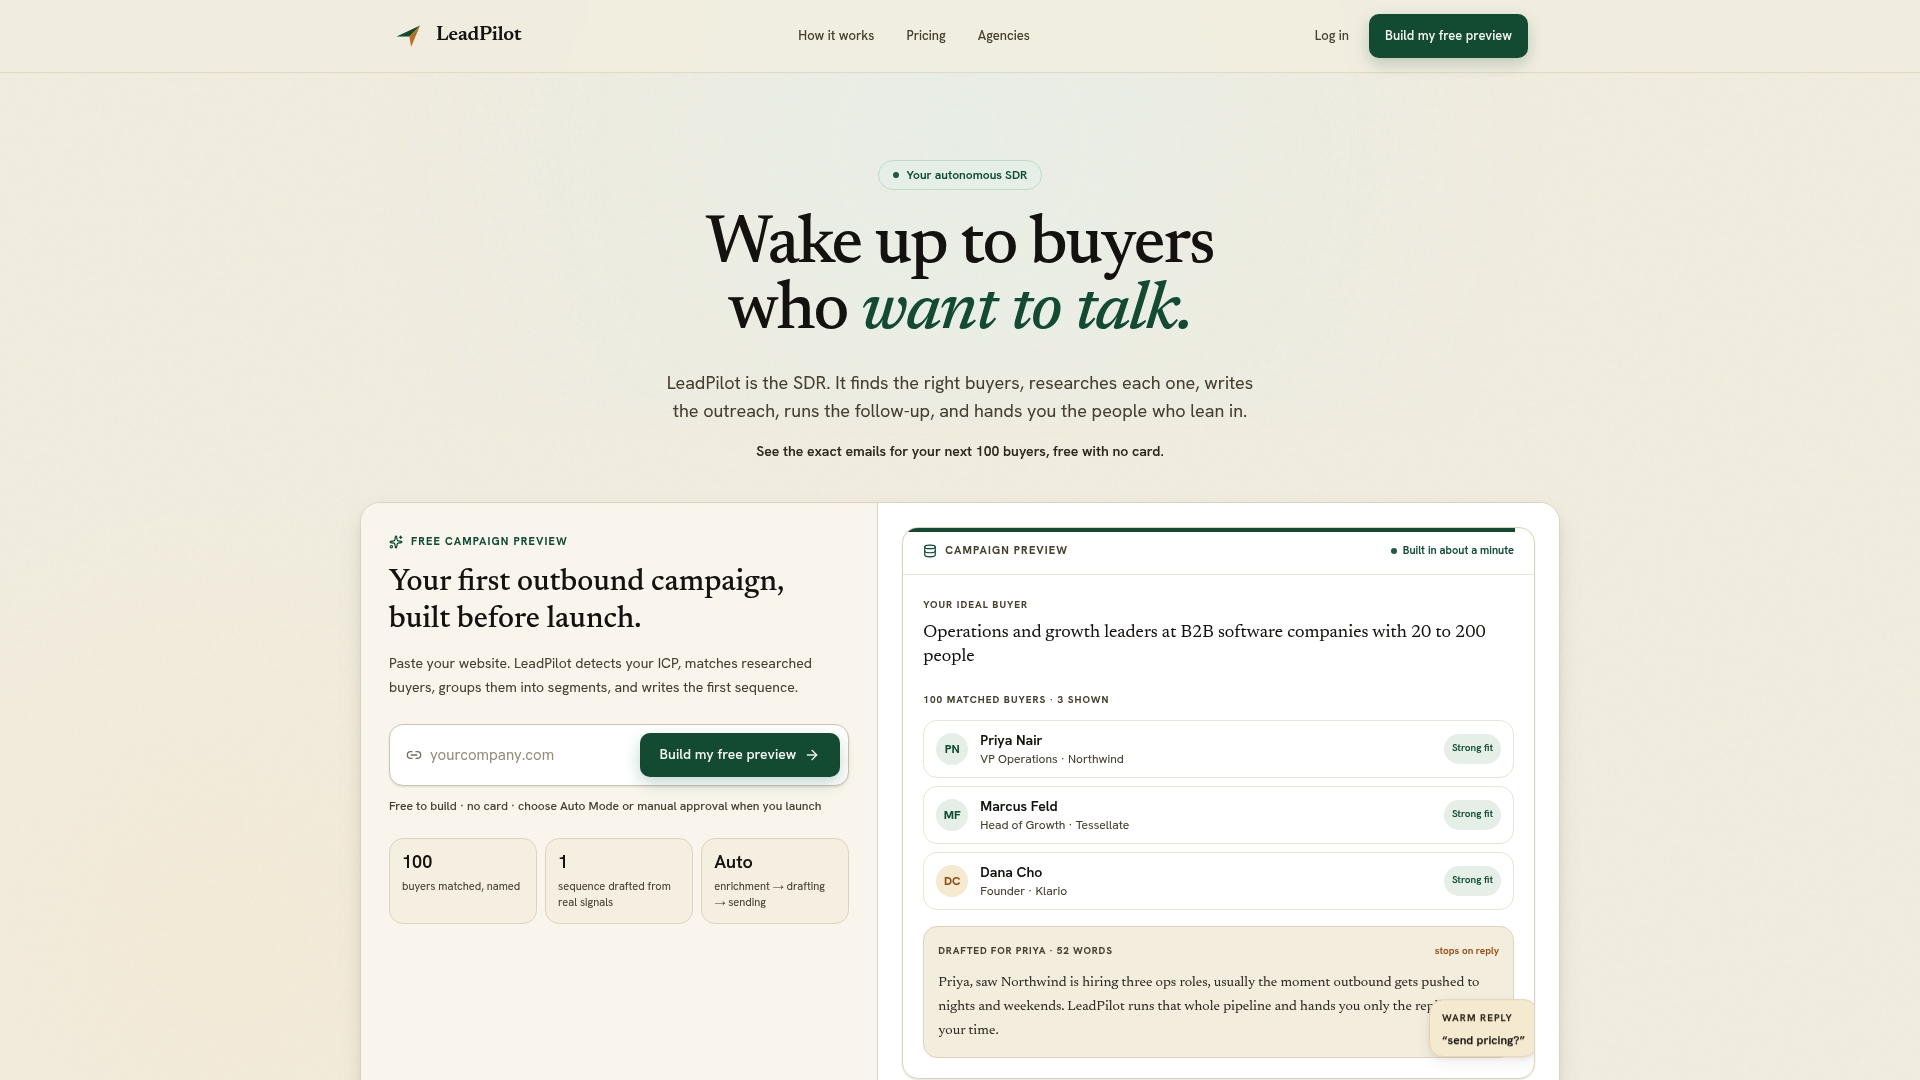
Runleadpilot handles the entire sequence: it reads your website to detect your ICP, enriches matched accounts with technographic and firmographic signals, drafts personalized cold email sequences from real stack data (not templates), manages dedicated sending domains for deliverability, runs automated follow-ups, and routes warm replies directly to your team. The AI SDR platform is built for founders and lean sales teams who need the output of a full SDR function without the headcount. Before committing to a managed plan, you can build a free campaign preview — see the account list, the detected signals, and the drafted sequences for your ICP before a single email goes out. Start your free campaign preview at runleadpilot.com.
Further reading and sources
-
Technographic Targeting: How To Find and Prioritize Accounts by the Tools They Use — Datablist: methodological guide covering detection categories, scoring models, and vendor-name normalization. Start here for the operational mechanics.
-
Outbound Sales Guides — Runleadpilot: campaign playbooks, outbound case examples, and practical guides for B2B sales teams running technographic-powered outreach.
-
Best Sales Prospecting Tools for B2B Teams in 2026 — Runleadpilot: tool comparison and workflow guidance for teams building a prospecting stack that incorporates technographic data.