Firmographic Targeting: The B2B Playbook for 2026
Unlock the power of firmographic targeting for B2B success in 2026. Learn how to define thresholds and optimize outreach effectively.

Firmographic Targeting: The B2B Playbook for 2026
Firmographic targeting means using company-level attributes — industry, size, revenue, location, ownership type — to find, prioritize, and personalize outreach to the organizations most likely to buy. The single first action to take: pick 3–5 firmographic thresholds that define your best-fit accounts and test them against your current pipeline data before touching a single ad or sequence.
Start here:
- Define your thresholds: Industry vertical (NAICS code or plain-language category), employee range (e.g., 50–500), and annual revenue band (e.g., $5M–$50M) are the three fastest to validate.
- Activate in your CRM: Route inbound leads to the right rep tier based on company size; flag accounts outside your thresholds for exclusion.
- Push to paid channels: Upload a matched company list to LinkedIn Matched Audiences or a similar platform to run account-level campaigns.
- Feed outbound sequences: Tag accounts by segment in your outbound tool so SDRs send the right cadence to the right tier.
That four-step loop is the whole game. The rest of this guide shows you how to build it properly, measure it, and keep it from decaying.
Table of Contents
- What does firmographic targeting actually cover?
- Which firmographic variables actually move the needle?
- Four segmentation strategies you can run this quarter
- How to build and activate firmographic segments end-to-end
- Where to get reliable firmographic data in the U.S.
- How to use growth signals to score and prioritize accounts
- How to measure whether your firmographic segments are working
- Common pitfalls that kill firmographic targeting programs
- Plug-and-play templates for SMB, mid-market, and enterprise
- Key Takeaways
- What I’ve learned running firmographic-driven campaigns
- Runleadpilot turns your firmographic segments into live outbound campaigns
- Useful sources and further reading
What does firmographic targeting actually cover?
Firmographics are the company-level equivalent of consumer demographics. Where B2C marketers use age, income, and location to profile individuals, B2B teams use firmographic data to classify organizations for targeting and prioritization. The key distinction: firmographics describe the account, not the person inside it.
Knowing when to reach for firmographics versus other B2B data types saves a lot of wasted effort. Here is a quick orientation:
| Data type | What it describes | Best used for |
|---|---|---|
| Firmographics | Company attributes (size, industry, revenue, location) | ICP definition, territory planning, pricing tier routing |
| Technographics | Software and tools a company uses | Competitive displacement, integration-led selling |
| Psychographics | Organizational values, culture, risk tolerance | Messaging tone, content strategy, brand positioning |
| Intent data | Active research behavior (topics, pages visited) | Timing outreach to in-market accounts |
| Contact demographics | Individual attributes (title, seniority, function) | Reaching the right person inside a target account |
Firmographics answer “which companies should we target?” The other types answer “when,” “how,” and “to whom.” A mature go-to-market motion uses all of them, but firmographics are the foundation. You cannot build a sensible ICP, set territory rules, or create pricing tiers without them.
Practical decisions firmographics drive: whether an account goes to an SMB rep or an enterprise AE, which product tier to lead with, whether a company qualifies for a self-serve or sales-assisted motion, and which geographic pod owns the relationship.
Which firmographic variables actually move the needle?
Not every firmographic attribute deserves equal weight. The ones that matter most are the ones that predict buying behavior, budget availability, and procurement complexity for your specific product. Here is the full list with what each one signals and when to prioritize it.

| Variable | What it indicates | When to prioritize it |
|---|---|---|
| Industry (NAICS/SIC) | Regulatory environment, use-case fit, buyer vocabulary | Always; it is the fastest filter for poor-fit exclusion |
| Employee count | Organizational complexity, likely budget tier, user vs. buyer gap | When your product scales with headcount (seats, licenses) |
| Annual revenue | Actual budget availability, deal size ceiling | When you sell on value or ROI and need to size the opportunity |
| Geographic location | Territory ownership, compliance requirements, time-zone logistics | Multi-region teams; regulated industries |
| Ownership/funding status | Decision-making speed, procurement formality, investor pressure | Startup vs. enterprise motion; funded vs. bootstrapped |
| Company age | Process maturity, tech stack sophistication, change appetite | When product requires organizational readiness |
| Public vs. private | Disclosure requirements, procurement process, budget cycles | Enterprise deals with formal procurement |
| Number of locations | Rollout complexity, multi-site licensing, support load | Products that deploy across physical sites |
| Hiring velocity | Growth trajectory, budget expansion, open headcount signals | Expansion-stage prospecting; growth-signal scoring |
| Technology stack | Integration fit, competitive displacement opportunity | Product-led or integration-led GTM |
Firmographic attributes like industry classification, employee count, annual revenue, geographic location, ownership type, funding stage, hiring velocity, years in operation, and technology stack form the standard set. The technology stack technically sits in technographic territory, but it functions as a cross-reference filter when your product integrates with or replaces a specific tool.
A few variables deserve extra attention. Employee count is often more actionable than revenue because it is easier to verify and changes more predictably. Revenue bands, on the other hand, are better for sizing deal potential when your pricing scales with contract value rather than seats. Company age and performance over time, including growth and decline metrics, help match cadence and content to organizational readiness — a two-year-old Series A company and a 20-year-old private firm in the same industry need completely different messaging.
Pro Tip: Set ranges, not exact numbers. “50–500 employees” is a testable, actionable threshold. “Exactly 200 employees” is a false precision that will shrink your list to nothing and is almost never accurate in source data anyway.
Four segmentation strategies you can run this quarter
Firmographic segmentation is not a single play. The four strategies below cover the most common GTM motions, from high-volume SMB outbound to low-volume enterprise ABM.
-
ICP tier segmentation (the foundation play) Filter by your two or three highest-signal variables — typically industry plus employee range plus revenue band — to create Tier 1, Tier 2, and Tier 3 account lists. Tier 1 gets the most personalized, AE-led outreach; Tier 3 gets automated nurture or exclusion. Example segment: SaaS companies, 100–500 employees, $10M–$75M ARR, U.S.-based. Example message: “We help SaaS teams at your stage cut SDR ramp time by automating the research and sequencing work.” Sales motion: AE-led for Tier 1, SDR cadence for Tier 2, marketing automation for Tier 3.
-
Product-fit segmentation (the use-case play) Combine industry with technology stack or ownership type to find accounts where your product solves a specific, verifiable problem. Example segment: E-commerce companies using Shopify Plus, 50–250 employees, Series A or B funded. Example message: “Shopify Plus merchants at your growth stage typically hit fulfillment bottlenecks around 10,000 monthly orders — here is how we solve that.” Sales motion: SDR-led with a tight discovery call focused on the specific pain point. Exclusion criteria matter here: exclude industries where the use case does not apply to preserve SDR time.
-
Regional/territory segmentation (the coverage play) Segment by geography combined with one or two other filters to align accounts with the right pod, comply with regional regulations, or localize messaging. Example segment: Healthcare technology companies, 200–1,000 employees, headquartered in the Southeast U.S. Example message: “HIPAA compliance timelines in the Southeast are tightening — here is how teams in your region are staying ahead.” Sales motion: Territory AE owns the list; SDR does initial outreach with region-specific context. On LinkedIn, pairing job function with seniority captures decision-makers within a geographic segment even when titles vary across companies.
-
Intent-tiered outreach (the timing play) Layer intent signals or growth signals on top of a firmographic base to find accounts that fit your ICP and are actively in a buying motion. Example segment: Fintech companies, 50–300 employees, recently funded (Series A/B in the last 90 days), hiring for sales or marketing roles. Example message: “Congrats on the round — teams at your stage usually need to double pipeline within 6 months. Here is how we help.” Sales motion: High-urgency SDR outreach within 72 hours of the trigger event. Company page audience targeting on LinkedIn can amplify this play by showing content to a tightly defined follower subset, driving higher engagement from exactly the accounts you are already working.
How to build and activate firmographic segments end-to-end
Building a segment definition is the easy part. Getting it live across CRM, ads, and outbound without creating a mess of duplicate records and conflicting tags is where most teams stumble. Here is the full checklist.

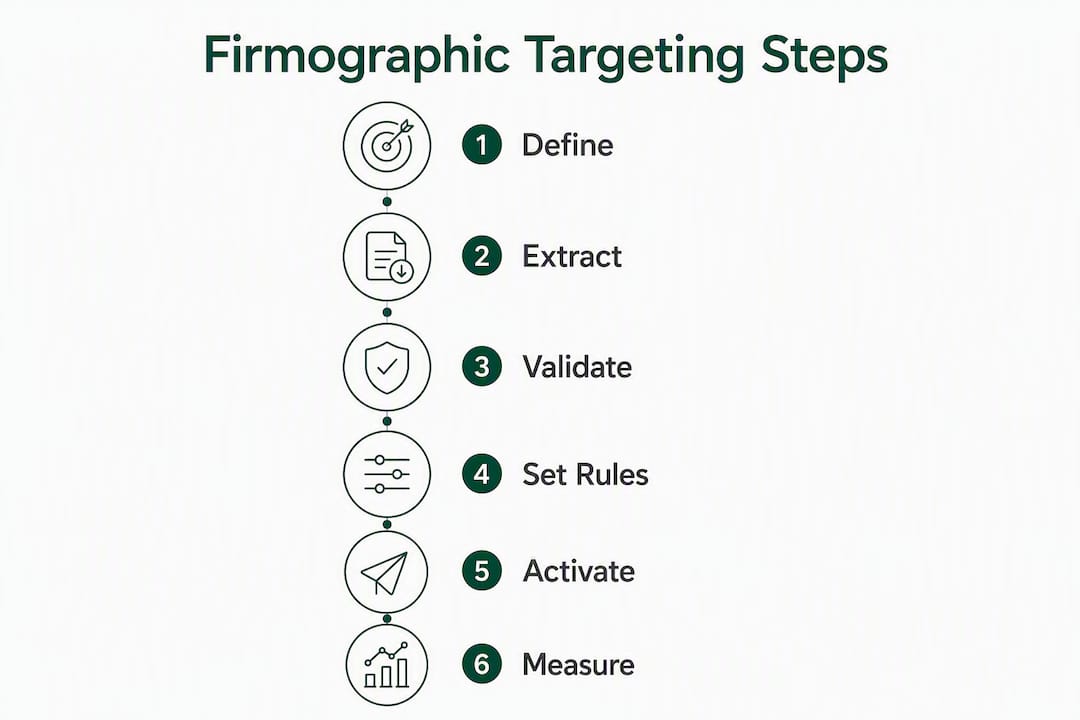
Step 1: Define your thresholds. Write down the exact values for each variable — not ranges like “medium-sized companies” but specific numbers: “100–500 employees, $10M–$100M revenue, SaaS or tech-enabled services, U.S.-based, Series A through Series C or bootstrapped with positive revenue.” Document this in a shared spec that RevOps and marketing both sign off on.
Step 2: Extract and enrich your list. Pull existing accounts from your CRM that match the thresholds. For gaps (missing revenue, outdated headcount), run an enrichment pass using a data vendor or API. Flag records where confidence is low.
Step 3: Validate a sample. Manually review 20–30 records before activating. Check that the industry classification is accurate, the headcount is current, and the company is not already a customer or a known poor fit. Fix systematic errors at the source before they propagate.
Step 4: Set routing and scoring rules in your CRM. Create a custom field or tag for the segment name. Set lead routing rules so inbound leads from matching accounts go to the right rep tier. Assign a base score to accounts in the segment.
Step 5: Build ad audiences. Upload the company list to LinkedIn Matched Audiences or a similar platform. Company list matching enables account-level campaigns that are more durable than contact-level targeting. Set exclusion lists for existing customers and known poor-fit accounts.
Step 6: Create outbound tags and sequences. Tag accounts in your outbound tool with the segment name. Assign the correct sequence (messaging, cadence length, send frequency) to each tag. Make sure the sequence copy references the firmographic context — company size, industry, or growth stage.
Step 7: QA and launch. Run a 48-hour QA pass: check that routing rules fire correctly, that ad audiences are above minimum delivery thresholds, and that outbound sequences are assigned to the right accounts. Then launch.
The activation mapping below shows which fields and tags to sync across systems:
| Firmographic field | CRM field/tag | Ad platform audience | Outbound sequence tag |
|---|---|---|---|
| Industry | industry_vertical |
Matched company list filter | seq_industry_[vertical] |
| Employee count | employee_range |
Company size filter | seq_size_[smb/mm/ent] |
| Revenue band | revenue_tier |
Not directly available; use company size proxy | seq_tier_[1/2/3] |
| Funding stage | funding_stage |
Not directly available; use company list | seq_funded_[stage] |
| Segment name | firmographic_segment |
Audience name | seq_segment_[name] |
One operational note: keep your CRM as the system of record. Sync outward to ad platforms and outbound tools, not the other way around. When a company changes size or industry, update the CRM field and let the sync propagate. Trying to maintain segment definitions in three places simultaneously is how lists drift apart.
Where to get reliable firmographic data in the U.S.
Data quality determines whether your segments are sharp or just expensive noise. The U.S. market has a range of sources, from free public registries to full enrichment APIs, and the right choice depends on your budget, the volume of accounts you are working, and how much accuracy you need.
Enrichment and append APIs are the workhorse for most growth-stage B2B teams. You feed them a domain or company name and get back structured firmographic fields. They work well for filling gaps in existing CRM records and for enriching new inbound leads in real time. The tradeoff: coverage varies by company size (excellent for mid-market and enterprise, thinner for very small businesses), and you pay per record or per enrichment call. For a comparison of leading options, the enrichment vendor landscape has shifted significantly in the last two years.
Full firmographic databases give you prospecting capability on top of enrichment. You can search by firmographic criteria and export lists, rather than just appending data to records you already have. These are the right choice when you are building net-new account lists for outbound or ABM. The cost is higher, and data freshness varies by vendor — some update monthly, others quarterly.
CRMs with built-in company enrichment (like HubSpot’s company enrichment or Salesforce’s Data.com successor integrations) are convenient for teams that want enrichment without a separate vendor contract. Coverage is usually narrower than a dedicated data provider, but the workflow integration is tighter.
Public and low-cost sources worth knowing:
- SEC EDGAR filings: For public companies, EDGAR provides verified revenue, employee counts, and ownership structure. Free, authoritative, but limited to public companies and updated on filing schedules.
- State business registries: Most U.S. states publish incorporation records, registered agent data, and sometimes officer names. Free, but inconsistent across states and rarely includes revenue or headcount.
- Crunchbase: Strong for funding stage, investor data, founding date, and headcount estimates for venture-backed companies. Less reliable for bootstrapped or private-equity-backed firms. Free tier is limited; paid plans unlock bulk export.
- LinkedIn company pages: Useful for headcount ranges (LinkedIn’s own data), industry classification, and recent hiring signals. Not exportable at scale without a Sales Navigator or API arrangement.
Pro Tip: No single source is complete. The most accurate firmographic profiles come from combining two sources: a primary enrichment API for structured fields and LinkedIn or Crunchbase for funding and growth signals. Cross-reference when a deal is large enough to justify the manual check.
How to use growth signals to score and prioritize accounts
Static firmographic filters tell you which companies could buy. Growth signals tell you which ones are ready to buy right now. The difference in conversion rates between a cold firmographic list and a signal-enriched one is significant enough that most mature outbound programs treat growth signals as a required layer, not a nice-to-have.
Growth signals like hiring rates, funding status, and new tech adoption function as dynamic proxies for buying intent. A company that just raised a Series B, posted 15 new sales roles, and adopted a new CRM in the last 60 days is not just a firmographic match — it is an account in active expansion mode with budget to spend and problems to solve.
A simple scoring model that works in practice:
| Signal | Points | Rationale |
|---|---|---|
| Firmographic ICP match (Tier 1) | 20 | Base qualification |
| Funding round in last 90 days | 15 | Budget availability signal |
| Hiring velocity: 10%+ headcount growth | 10 | Expansion mode indicator |
| New technology adoption (relevant stack) | 10 | Integration or displacement opportunity |
| Leadership change (new VP/C-suite hire) | 8 | New buyer, new priorities |
| Company age 2–7 years | 5 | Growth stage, not yet enterprise-locked |
| Total possible | 68 |
Accounts scoring 40+ get immediate SDR outreach. Accounts scoring 25–39 go into a nurture sequence with a 30-day check-in. Accounts below 25 stay in the CRM as low-priority until a signal fires.
A before/after example: a raw firmographic list of 500 SaaS companies (100–500 employees, $10M–$75M revenue) might yield 50 accounts worth immediate outreach. Run that same list through the scoring model above and you will typically surface 60–80 high-priority accounts — because some companies that barely made the firmographic cut have strong growth signals, and some that looked ideal are flat or contracting.
Pro Tip: Tune your weights quarterly using conversion data. If funded accounts are closing at twice the rate of unfunded ones, double the funding signal weight. If leadership changes are not correlating with closes in your data, drop that signal. The model is only as good as the feedback loop you build into it.
How to measure whether your firmographic segments are working
Firmographic targeting without measurement is just expensive guesswork. The KPIs below give you a segment-level view of what is working, and the experiment structure tells you how to prove it.
| KPI | What it measures | Target signal |
|---|---|---|
| Impression/reach by segment | Audience delivery and coverage | Consistent delivery; no under-delivery |
| CTR / engagement rate | Message-market fit at the top of funnel | Higher than baseline for targeted segments |
| MQL-to-opportunity rate | Segment quality and sales acceptance | Improving vs. non-segmented baseline |
| Sales-accepted lead (SAL) rate | Sales team’s confidence in segment fit | High for Tier 1 segments |
| Opportunity win rate | Full-funnel segment performance | Higher than overall average |
| Time-to-close | Sales cycle efficiency by segment | Shorter for well-defined ICP segments |
| CAC by segment | Cost efficiency of the targeting approach | Lower than blended CAC for priority segments |
For experiment design, A/B testing targeting combinations while holding creative constant is the reliable way to isolate the effect of firmographic filters on conversion. Here is a practical setup:
- Control group: Broad industry targeting with no size or revenue filter.
- Test group: Same industry plus employee range (e.g., 100–500) plus revenue band (e.g., $10M–$75M).
- Hold constant: Ad creative, landing page, offer, and sequence copy.
- Duration: Run for at least 4–6 weeks or until each group has reached a statistically meaningful number of MQLs (aim for 50+ per group before drawing conclusions).
- Decision trigger: If the test group’s MQL-to-opportunity rate is 15% or more above the control group’s, roll the filter combination into your standard targeting. If the difference is smaller, test a different variable combination.
One rule that prevents premature conclusions: do not optimize on CTR alone. A hyper-targeted segment will almost always show higher CTR because the audience is more relevant, but if it does not convert to pipeline at a higher rate, the targeting is not actually better — it is just more expensive per impression.
Common pitfalls that kill firmographic targeting programs
Most firmographic targeting failures are not strategy failures. They are operational failures: bad data, over-engineered filters, and no one owning the maintenance. Here is what to watch for.
Red flags that signal a problem:
- Your LinkedIn ad audience drops below 50,000 members after applying filters. Hyper-targeting can shrink audiences below delivery thresholds, preventing the algorithm from learning and delivering efficiently. LinkedIn recommends layering no more than two extra filters beyond location to preserve optimization.
- Your outbound reply rates drop sharply after a list refresh. This usually means the enrichment data is stale — B2B data decays at roughly 22.5% per year, about 2.1% per month, so a list built six months ago has meaningful inaccuracy baked in.
- SDRs are manually disqualifying more than 20% of accounts in a segment. That is a signal that your firmographic thresholds are too loose or your data source has poor coverage for that company type.
- Two teams are maintaining separate versions of the same segment definition. This is a governance failure that leads to conflicting reports and wasted outreach.
Governance checklist:
- Assign a single owner (typically RevOps) for each firmographic segment definition.
- Set a refresh cadence: quarterly for standard segments, monthly for high-value or expansion-stage segments.
- Define a source-of-truth field in your CRM for each firmographic variable. No overrides from ad platforms or outbound tools.
- Track list accuracy as a formal metric: what percentage of records in a segment have complete, verified firmographic data?
- Set a quality SLA: no segment goes live with more than 15% missing or unverified records.
Practical mitigations:
- Build exclusion lists before you build inclusion lists. Exclude known poor-fit industries, existing customers, and accounts currently in an active deal cycle. Qualifying accounts out is as valuable as qualifying them in.
- Set minimum audience thresholds for paid channels before activating. On LinkedIn, 300 members is the technical minimum for many ad features, but 50,000+ is the practical minimum for efficient delivery.
- Run a scrubbing pass on any list older than 90 days before reactivating it in a new campaign.
Pro Tip: When you start broader and refine over time, the ad platform’s algorithm has enough data to learn which accounts within your firmographic range actually convert. Locking down to a hyper-specific audience on day one prevents that learning from happening.
Plug-and-play templates for SMB, mid-market, and enterprise
These three templates are designed to be copied directly into your CRM, outbound tool, or ad platform. Adjust the thresholds to match your product’s actual ICP data.
SMB segment template
Firmographic thresholds: SaaS or tech-enabled services, 10–100 employees, $1M–$10M revenue, U.S.-based, bootstrapped or pre-Series A.
Value proposition: “We help small SaaS teams punch above their weight on outbound without hiring a full SDR team.”
Subject lines:
- “How [Company] can book more demos without adding headcount”
- “Outbound for lean teams — what’s actually working in 2026”
Cadence outline: Day 1 cold email, Day 4 follow-up with a specific use case, Day 8 LinkedIn connection request, Day 14 final email with a soft opt-out offer. Total: 4 touches over 14 days.
Personalization tokens: Company name, founder name, recent product launch or funding mention if available.
Mid-market segment template
Firmographic thresholds: B2B software or professional services, 100–500 employees, $10M–$75M revenue, U.S.-based, Series A–C or profitable private.
Value proposition: “Mid-market sales teams at your stage typically have the pipeline problem, not the product problem — we help fix the former.”
Subject lines:
- “[Company]'s outbound motion at 200 employees — a quick thought”
- “Pipeline velocity for [industry] teams: what the data shows”
Cadence outline: Day 1 cold email, Day 3 follow-up with a relevant case study reference, Day 7 LinkedIn message, Day 12 email with a specific question, Day 18 breakup email. Total: 5 touches over 18 days.
Personalization tokens: Company name, industry vertical, employee count, recent hiring signal or funding round.
Enterprise segment template
Firmographic thresholds: Enterprise software, financial services, or healthcare technology, 500+ employees, $75M+ revenue, public or PE-backed, U.S. headquarters.
Value proposition: “Enterprise procurement cycles are long — we help your team stay top-of-mind with the right stakeholders across a 6–12 month buying process.”
Subject lines:
- “[Company]'s Q3 pipeline: a perspective from the outside”
- “How [industry] enterprises are restructuring outbound in 2026”
Cadence outline: Day 1 personalized cold email to VP/C-suite, Day 5 follow-up with an industry-specific insight, Day 10 LinkedIn connection to a second stakeholder, Day 20 email with a relevant reference or case study, Day 35 check-in. Total: 5 touches over 35 days.
Personalization tokens: Company name, executive name and title, recent company news (earnings, acquisition, product launch), industry benchmark.
Pro Tip: You do not need to write 50 unique emails to personalize at scale. Two or three company-level tokens — industry, size tier, and one recent signal — do most of the work. The rest of the email can be templated. Readers notice the specific detail, not the boilerplate around it.
Key Takeaways
Firmographic targeting works when you combine precise account-level thresholds with dynamic growth signals, activate segments consistently across CRM, ads, and outbound, and maintain data quality through formal governance.
| Point | Details |
|---|---|
| Start with 3–5 thresholds | Industry, employee range, and revenue band are the fastest variables to validate against existing pipeline data. |
| Layer growth signals for prioritization | Funding rounds, hiring velocity, and tech adoption score accounts above the firmographic baseline and surface ready-to-buy accounts. |
| Maintain data quality actively | B2B data decays at roughly 22.5% per year; set regular refresh cadences and a source-of-truth CRM field for every firmographic variable. |
| Measure at the segment level | Track MQL-to-opportunity rate, SAL rate, and win rate by segment — not just overall — to know which firmographic filters are actually driving pipeline. |
| Runleadpilot automates the workflow | Runleadpilot detects your ICP from your website, sources matching decision-makers, and wires firmographic segments directly into personalized cold email sequences and follow-ups. |
What I’ve learned running firmographic-driven campaigns
The gap between a firmographic strategy that looks good in a slide deck and one that actually generates pipeline usually comes down to three things: data quality, over-engineering, and the absence of a feedback loop.
The most common mistake I see is teams building elaborate 6-variable segment definitions before they have validated even the most basic thresholds. You do not need to know whether a company is PE-backed versus VC-backed before you know whether your product fits a 100-person SaaS company at all. Start with two variables, validate them against closed-won data, and add complexity only when the simpler model stops discriminating.
The second lesson is about exclusions. Most teams spend all their energy defining who to target and almost none defining who to exclude. A tight exclusion list — industries that never buy, company sizes that churn immediately, geographies your team cannot support — often improves campaign performance faster than refining the inclusion criteria. It is unglamorous work, but it is where a lot of SDR time gets recovered.
The third thing: firmographic data is not static, and treating it as if it were is expensive. A company that was a perfect ICP fit 18 months ago may have been acquired, shrunk, or pivoted. The teams that maintain accurate lists outperform the ones that build a great list once and let it decay. The ICP vs. persona framework is worth revisiting every quarter alongside your data refresh cycle — the two processes reinforce each other.
One more thing worth saying plainly: firmographic targeting is not a substitute for good messaging. A perfectly segmented list with generic copy will underperform a decent list with a message that speaks directly to the account’s situation. The firmographic context should show up in the email, not just in the filter that determined who received it.
Runleadpilot turns your firmographic segments into live outbound campaigns
Building a firmographic segment is one thing. Wiring it into a running outbound program — with personalized copy, dedicated sending domains, follow-up sequences, and warm reply routing — is the part that takes most teams weeks to set up manually.
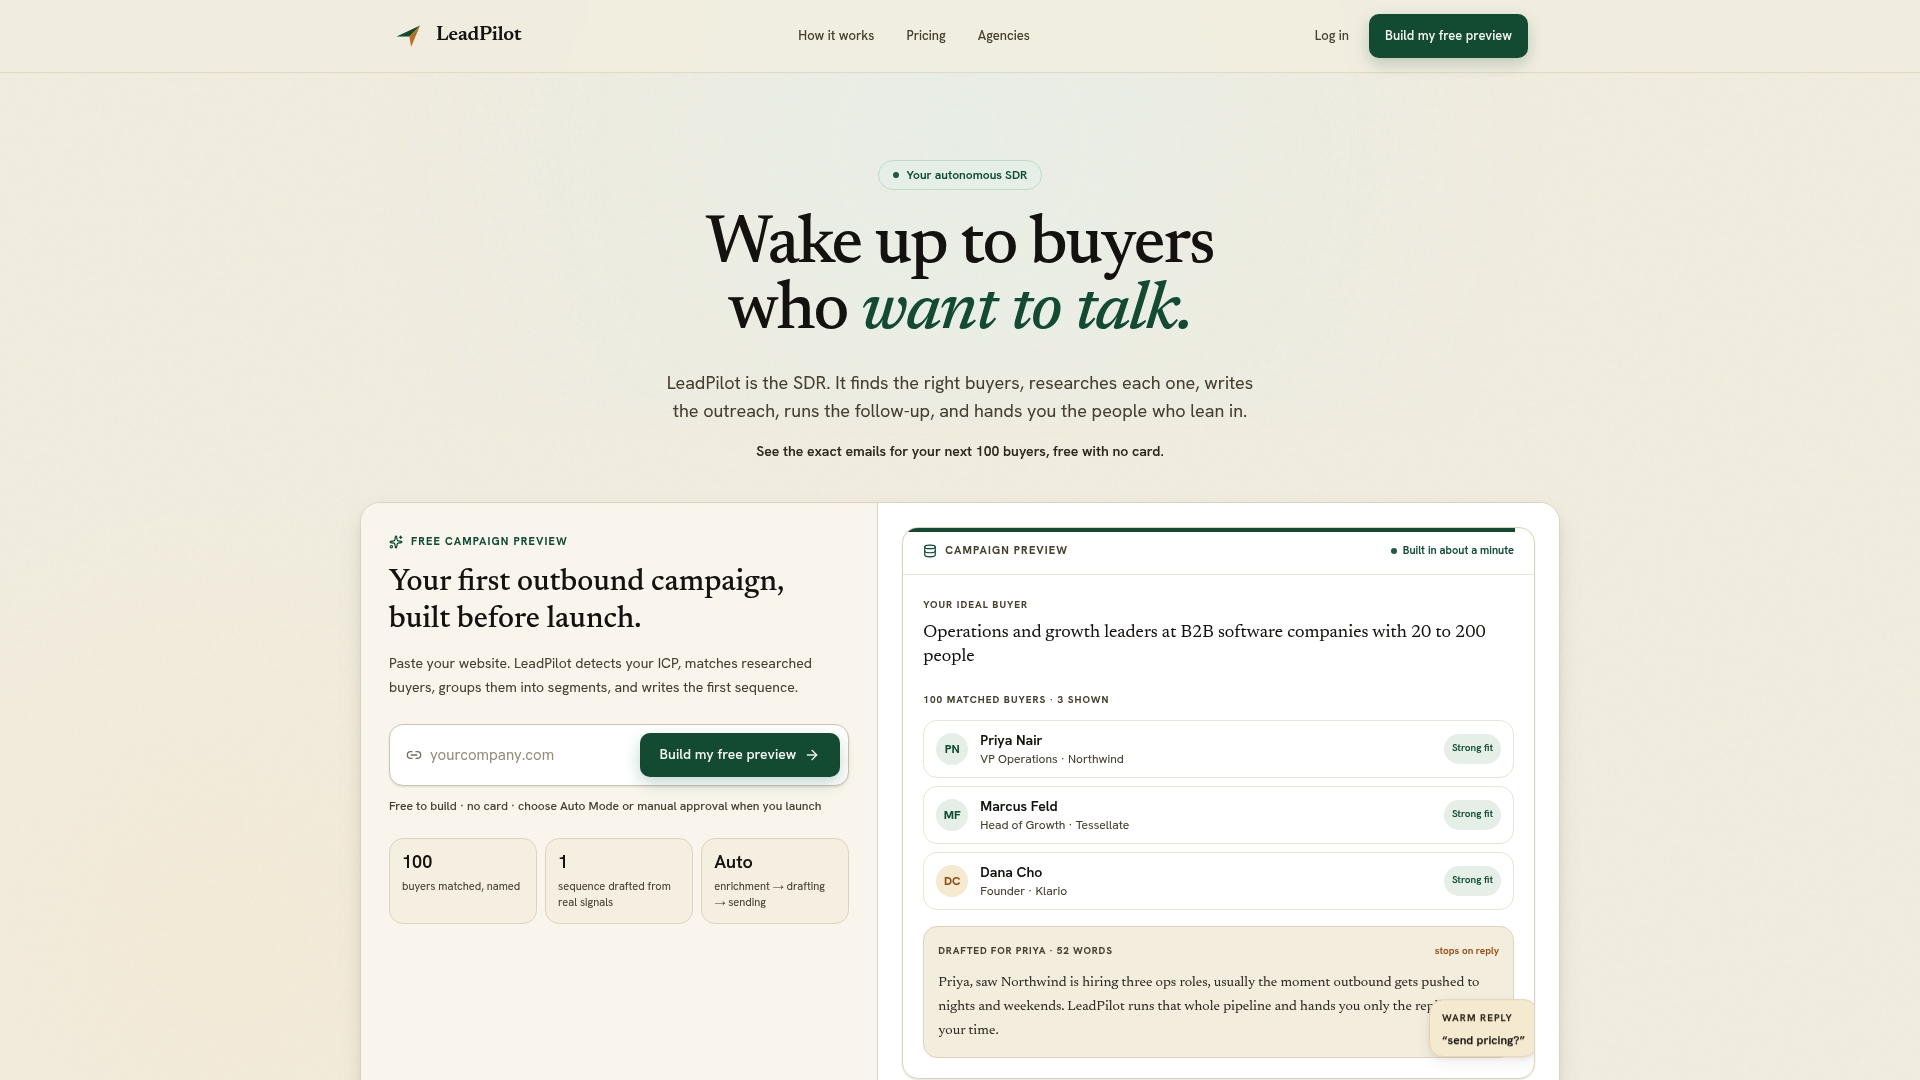
Runleadpilot reads your website, detects your ICP automatically, sources matching decision-makers, and writes cold emails from real business signals like funding rounds, hiring velocity, and tech stack. You get a full AI SDR workflow from firmographic targeting through reply handoff, without building the infrastructure yourself. Dedicated sending domains and inbox management are included, so deliverability is handled from day one.
The practical difference: instead of spending two weeks defining segments, enriching lists, writing sequences, and configuring your sending setup, you get a free campaign preview that shows you exactly which accounts Runleadpilot would target and what the outreach would look like before you commit to a paid plan. For lean sales teams and agencies running outbound for multiple clients, that preview is the fastest way to see whether the segment-to-sequence wiring matches your ICP.
Useful sources and further reading
- Firmographic Data: The Complete B2B Targeting Guide — Authoritative reference on firmographic variables, data decay rates, and ICP segmentation best practices.
- LinkedIn Ads Targeting Explained: The B2B Targeting Options That Actually Matter — Practical guidance on combining firmographic filters with LinkedIn’s targeting capabilities, including growth signal use cases.
- LinkedIn Ads Targeting Capabilities: The Complete Guide — Detailed breakdown of LinkedIn’s audience features, minimum size thresholds, and filter-layering constraints.
- Firmographic Segmentation: How to Use the 8 Variables to Target Your Audience — Covers performance-over-time metrics and sales-cycle-aligned segmentation variables.
- LinkedIn Company Page Audience Targeting — Explains how to use company page follower targeting for high-value account subsets.
- Best Clearbit Alternatives for B2B Teams — Overview of the current enrichment vendor landscape for U.S. B2B teams.
- Best Sales Prospecting Tools for B2B Teams — Covers how dynamic signals like funding and tech-stack changes integrate with prospecting workflows.
- Outbound Sales Guides — Implementation checklists and playbooks for CRM activation, segmentation, and outbound sequencing.